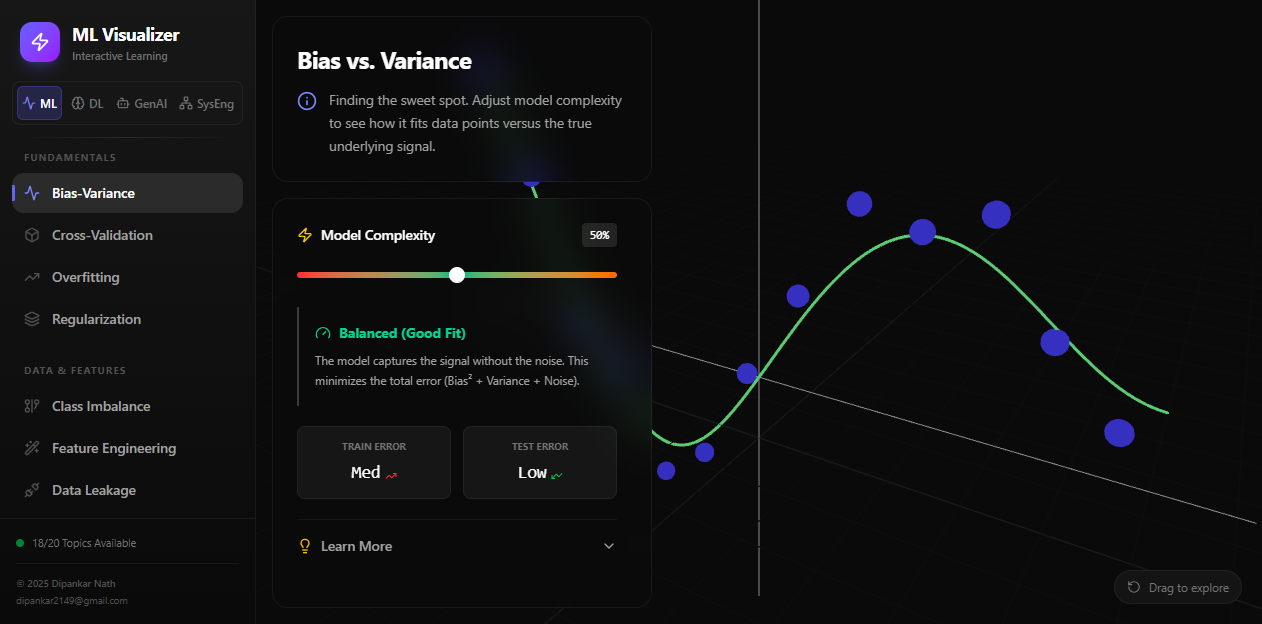
ML Visualizer is an interactive learning platform that turns abstract machine-learning concepts into things you can see and play with. Instead of reading a definition of bias–variance tradeoff, you drag a slider and watch the model curve overfit or underfit in real time.

The idea
Most people learn ML from static diagrams and equations. ML Visualizer flips that: every concept is a hands-on, interactive visualization. Move a control, and the chart, error metrics, and explanation all update live — so the intuition clicks.
What’s inside
18 of 20 topics are live, organized into learning tracks:
- Fundamentals — Bias-Variance, Cross-Validation, Overfitting, Regularization
- Data & Features — Class Imbalance, Feature Engineering, Data Leakage, Dimensionality Reduction
- Algorithms — K-Means Clustering, Logistic Regression, Random Forest (Decision Trees & SVM coming soon)
- Models & Training — Gradient Descent, Activation Functions, Hyperparameters, Ensembles
- Evaluation & Ops — Metrics, Interpretability, Monitoring
Topics span four domains: ML, Deep Learning, GenAI, and Systems Engineering.
Example: Bias vs. Variance
The flagship view lets you drag a Model Complexity slider from 0–100%:
- Low complexity → the model underfits (high bias), the curve is too simple.
- High complexity → it overfits (high variance), chasing noise.
- Balanced → it captures the true signal, and the live Train/Test error readouts show the sweet spot where total error is minimized.
Seeing the curve and the error numbers move together makes the tradeoff obvious in a way a textbook diagram never could.
Why I built it
Teaching intuition is hard with static content. An interactive tool lets a learner build a mental model by experimenting — which is how these concepts actually stick. It’s also a fun playground for anyone brushing up before interviews.
Built as a self-directed project. Try the live demo and drag the sliders around.